


A significant increase in the number of building permits granted in Turkey during 2021
2026-04-13
9,561 Views
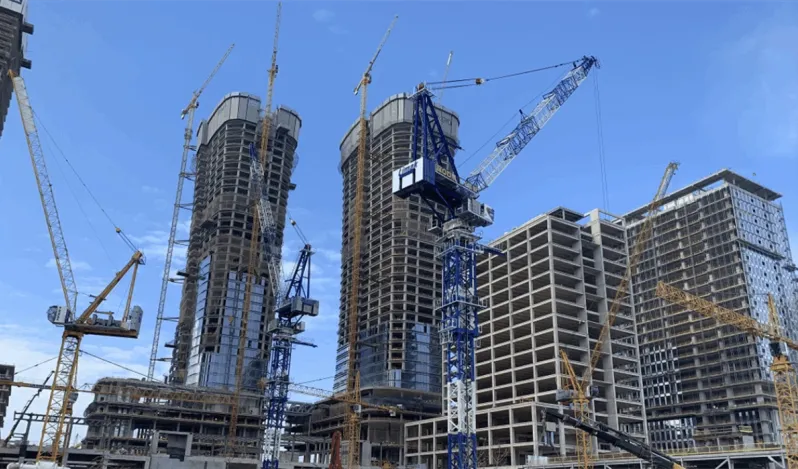


Table of Contents
The number of building permits granted by municipalities throughout Turkey last year reached 136,474 building permits, achieving a progress of 42.2% compared to the number of building permits granted in the previous year.
According to data issued by the Turkish Statistical Institute (TÜİK), the number of licensed units in buildings last year reached 709,936 units, marking an increase of 27.8% compared to the number of units in licensed buildings in 2020.
In terms of area classification, the total area of licensed buildings throughout Turkey last year reached 148,614,708 square meters, achieving an increase of 32.3% compared to the total area of licensed buildings throughout Turkey in 2020.
Statistics for the last quarter of 2021 showed an increase on all levels
As for statistics related to the last quarter of 2021, building permits during the last quarter of 2021 saw a significant increase, with the number of buildings granted building permits by municipalities throughout Turkey during that period reaching 42,269 buildings, an increase of 14% compared to the number of licensed buildings during the same period in 2020.
The number of units in licensed buildings during the last quarter of last year reached 228,408 units, an increase of 16.8% over the same period in 2020.
In terms of area, the area of licensed buildings during the last quarter of last year reached 49,249,082 square meters, an increase of 24.1% compared to the licensed areas during the same period in 2020.
|
Year |
Quarter |
Number of buildings |
Annual change rate |
Number of units |
Annual change rate |
Building areas |
Annual change rate |
|
2020 |
1 |
14092 |
3.4 % |
80834 |
5.2 % |
17472026 |
-10.4 % |
|
2 |
19556 |
118.4 % |
137899 |
207.6 % |
27397193 |
141.6 % |
|
|
3 |
25270 |
132 % |
141119 |
154.7 % |
27799104 |
98.6 % |
|
|
4 |
37083 |
66.8 % |
195485 |
37 % |
39675137 |
39.1 % |
|
|
Total |
96001 |
72.3 % |
555337 |
73.7 % |
112343460 |
53.2 % |
|
|
2021 |
1 |
33410 |
137.1 % |
174435 |
115.8 % |
34316671 |
96.4 % |
|
2 |
30452 |
55.7 % |
157475 |
14.2 % |
31696459 |
15.7 % |
|
|
3 |
30343 |
20.1 % |
149618 |
6 % |
3352496 |
20 % |
|
|
4 |
42269 |
14 % |
228408 |
16.8 % |
49249082 |
24.1 % |
|
|
Total |
136474 |
42.2 % |
709936 |
27.8 % |
148614708 |
32.3 % |
Residential buildings captured the largest share of the licensed area
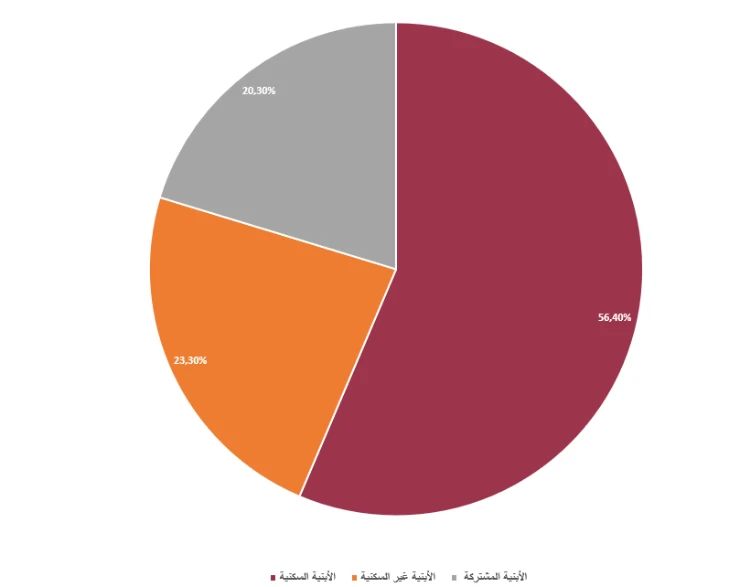
In the classification of licensed areas according to building types, residential buildings captured the largest share of licensed building areas during the last quarter of last year, accounting for 56.4% of the total licensed building areas during the mentioned period.
Non-residential buildings ranked second, accounting for 23.3% of the total licensed building areas during the mentioned period, and mixed-use buildings ranked third with 20.3% of the total licensed building areas during the same period.
Multi-unit buildings received the most licenses
In the classification of licensed buildings according to their intended use, multi-unit buildings accounted for the largest share of the total area of licensed buildings during the last quarter of last year, at 69.2% of the total licensed building area, followed by single-unit buildings at 8.2% of the licensed areas, and then public facilities buildings at 6.3%.
The classification of licensed buildings according to their intended use and their area percentages was as follows:
|
No. |
Types of buildings by use |
Percentage of total licensed area |
|
1 |
Multi-unit buildings |
69.2 % |
|
2 |
Single-unit buildings |
8.2 % |
|
3 |
Public facilities buildings and their maintenance |
6.3 % |
|
4 |
Industrial buildings and their warehouses |
5.8 % |
|
5 |
Buildings designated for wholesale and retail trade |
3 % |
|
6 |
Office buildings and workplaces |
2.9 % |
|
7 |
Other buildings not designated for accommodation |
2.3 % |
|
8 |
Hotels and their annexes |
0.9 % |
|
9 |
Transport and communications buildings |
0.8 % |
|
10 |
Residential facilities open to the public |
0.6 % |
Edited by: Imtilak Real Estate
Source: Tüik
Did you like our topic? You can share it with your friends!Do you like this topic? You can share it with your friends now!


More From Imtilak
Investment & Real Estate Ownership in Turkey
Apartment sales in Turkey record the highest rate in June 2025 in three years


Investment & Real Estate Ownership in Turkey
Renewed Interest of Foreigners in Buying Real Estate in Turkey
Investment & Real Estate Ownership in Turkey
Turkey Launches a Digital Revolution in the Real Estate Market